 I am a big promoter of using concept mapping to access the implicit knowledge that is trapped in our brains. Concept maps are graphic representations of knowledge that facilitate the organization of information, whether it is for a project we are planning or for research we are engaged in. I use the CmapTools software since it also allows me to save concept maps on a server and share them online.
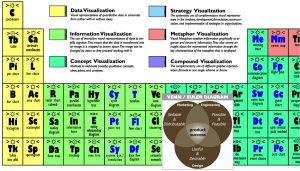
It is, however, not the only technique for concept visualization, which is why I have often turned to the Periodic Table of Visualization Methods for inspiration. The table also includes methods for visualizing quantitative data (pie charts, line graphs, etc.) mapped to the alkali metals, methods for information visualization that transform data into images (data maps, flow charts, etc.), strategy visualization used commonly in management (such as stakeholder maps), metaphor visualization to convey insights about information (metro maps, bridges, etc.), and, lastly, compound visualization methods that bring together multiple graphical representation formats. Each element box also has additional information, such as the mode of thinking.
If you have any trouble scrolling over the element boxes and would like to see each of the methods separately, Chris Wallace has implemented an XML page that allows you to hide or view each image and also links out to Google images and Wikipedia entries.
Next week I will be attending the Visual Thinking with Mind-Mapping and Creative Modeling workshop at the School of Continuing Studies. I will be sure to post on what I learn there and share any new resources I come across. If you have any to share please do so in the comments box.
Have fun expressing yourself with these visualization methods!
