I was poking around some analytics reports this morning and realized that it had been a while since I updated the browser stats for the web traffic on the Library’s web site. You can see the latest numbers in the table below.
| Browser | Sept 2012 | Sept 2013 | Sept 2014 | Sept 2015 | Change |
| Internet Explorer | 44% | 38% | 37% | 32% | -12% |
| Firefox | 22% | 20% | 14% | 21% | -1% |
| Chrome | 16% | 23% | 30% | 27% | +11% |
| Safari | 16% | 18% | 18% | 19% | +3% |
The general trend continues to be IE dropping off while Chrome gains. Firefox came back after taking a big dip in 2014, but at best to keeping even.
I thought I would add a second table to this report showing how the traffic from different device categories is evolving as well. I’m not sure if the counts are as meaningful for the earlier years, but here is what Google Analytics is reporting.
| Device |
Sept 2012 | Sept 2013 | Sept 2014 | Sept 2015 | Change |
| Desktop | 97% | 95% | 92% | 90% | -7% |
| Mobile | 2% | 4% | 6% | 7% | +5% |
| Tablet | 1% | 2% | 2% | 3% | +2% |
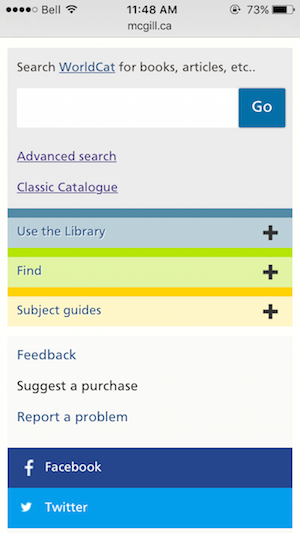
Unsurprisingly, the majority of our traffic comes from desktop PCs, with mobile and tablet use slowly starting to climb. The rate of change may increase, though, now that our home page is finally responsive and does a much better job of displaying on mobile devices.
It is important to keep in mind that many of our patrons do not go through the Library web site to access our resources! Many will use Google/Google Scholar or will have WorldCat or their favorite databases bookmarked. Still, I think these numbers can give us a general idea of the browsers and devices being used my our patrons.


