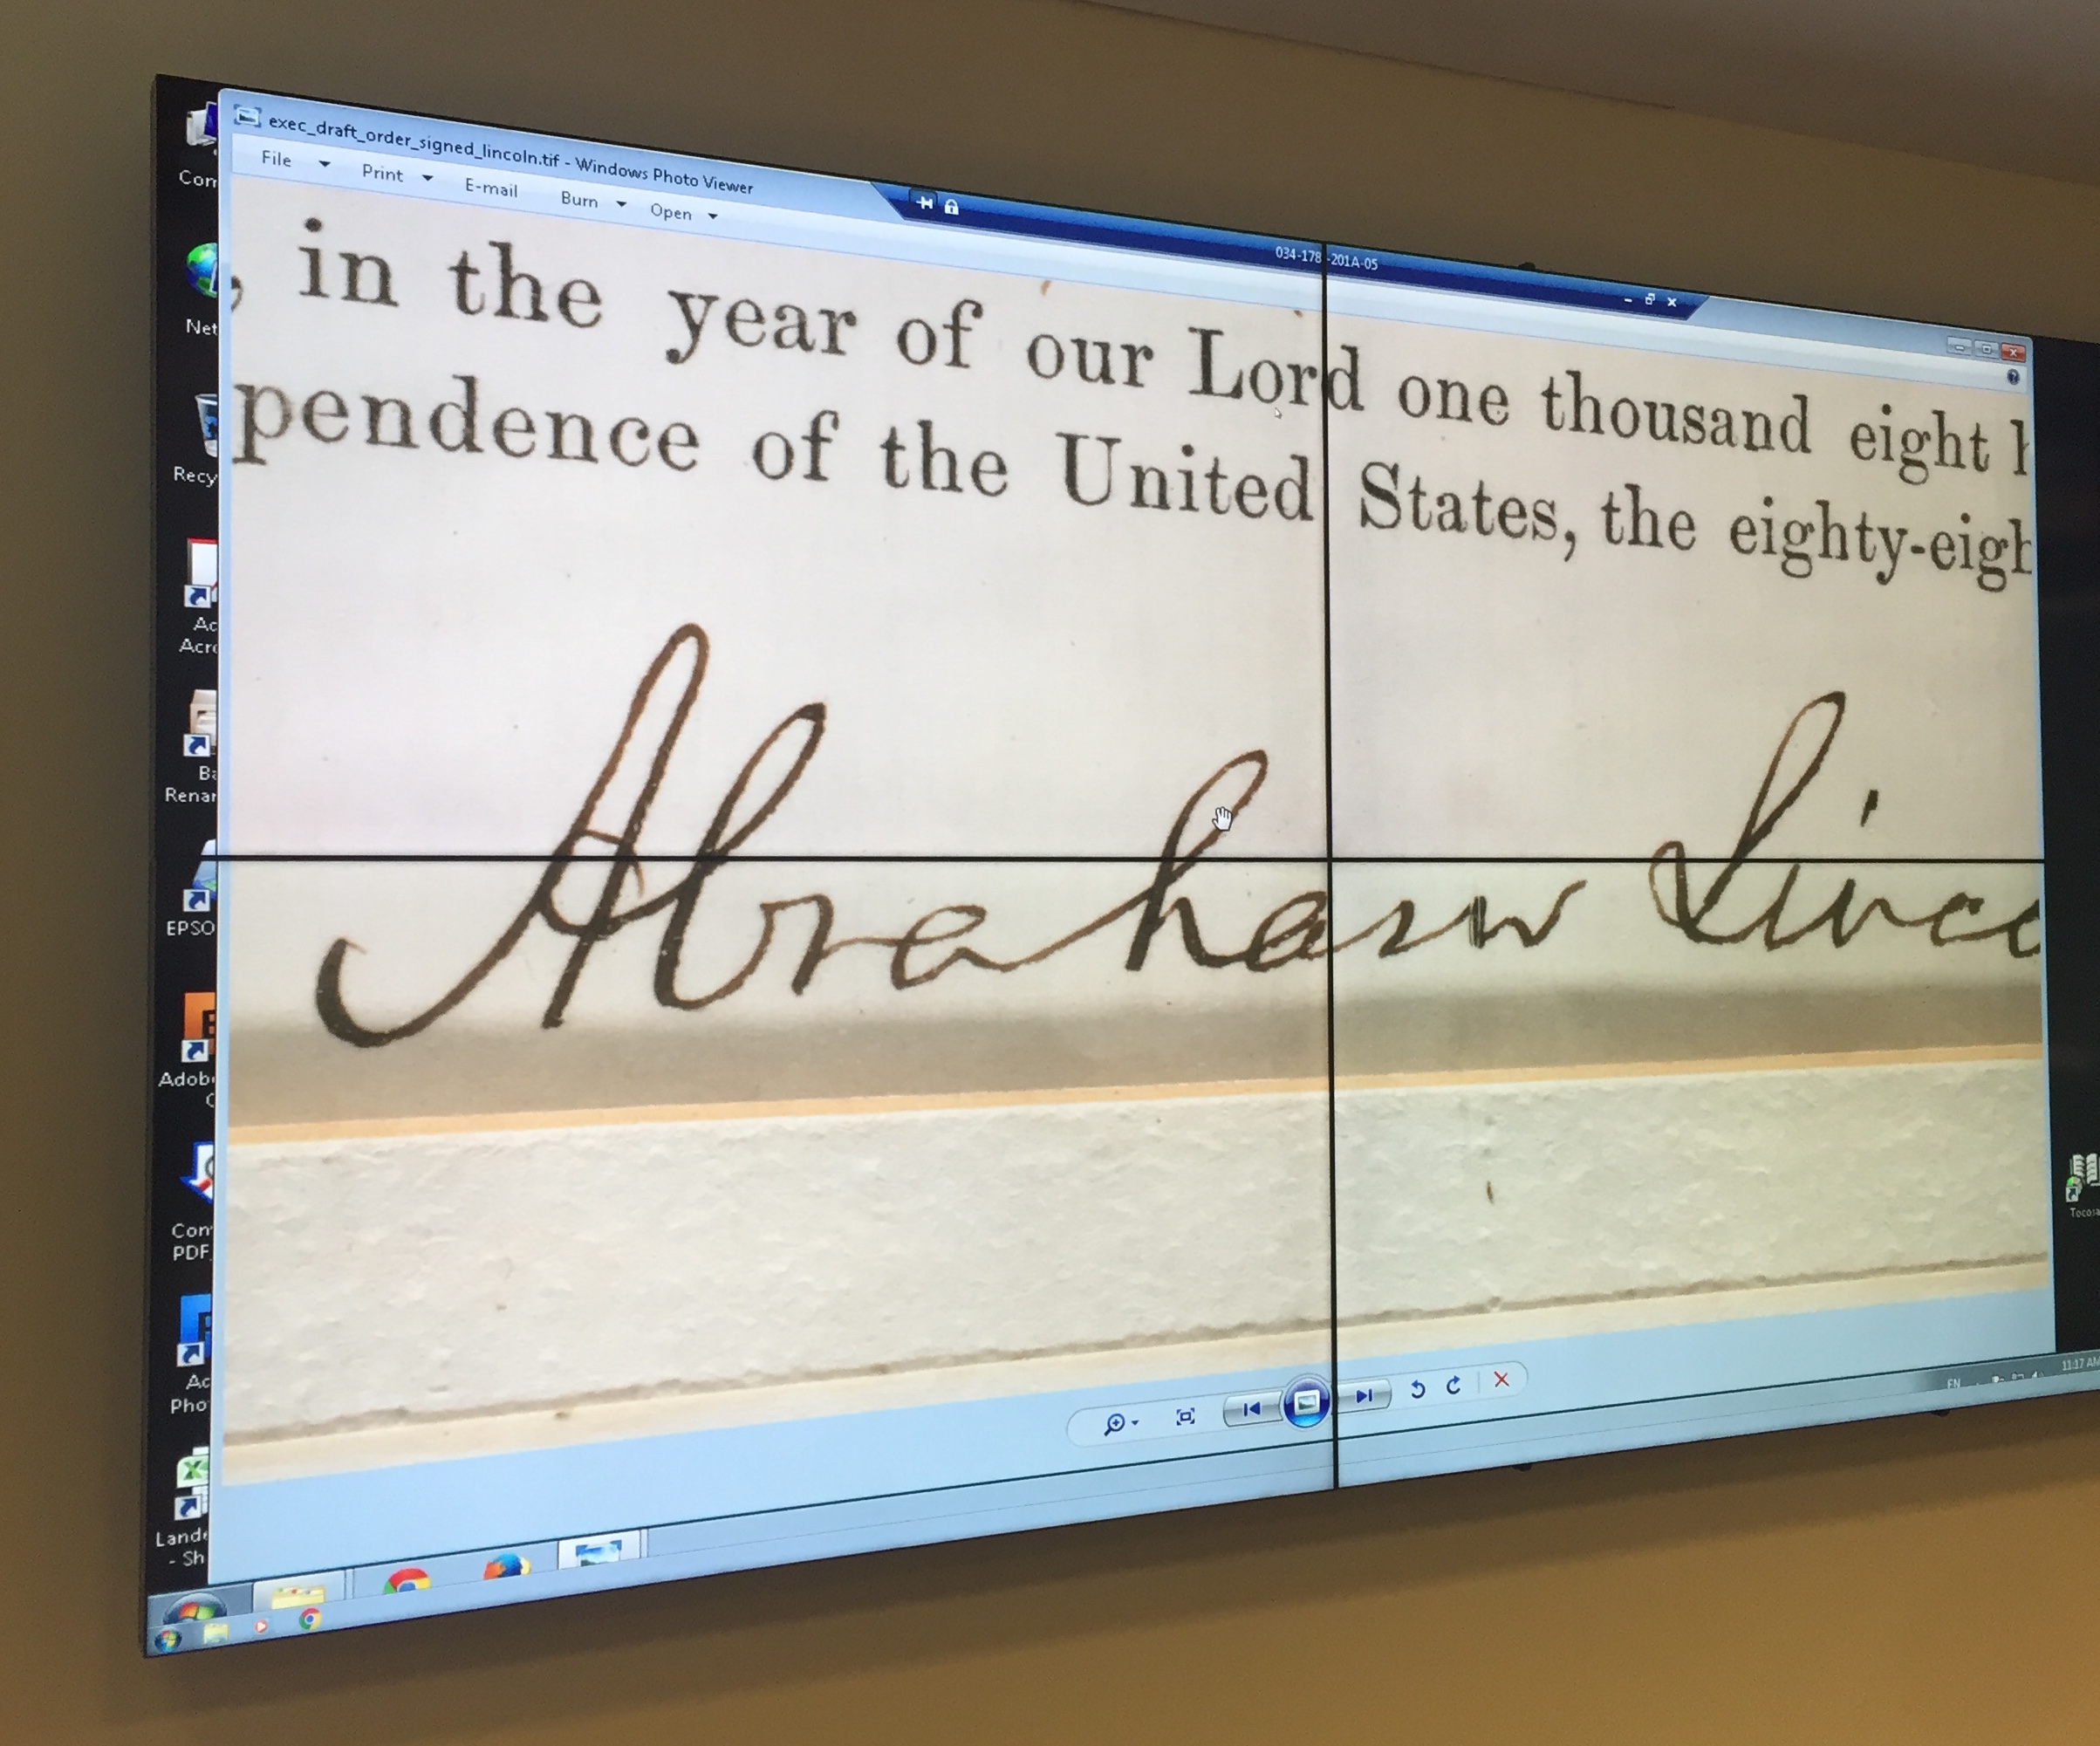
This week we went downstairs to the main floor of Redpath Library to play with the new visualization wall which is made up of eight 55-inch screens in the Research Commons. The first thing we wanted to see was how some of our digitized images looked up on the big wall. First we pulled up an a miniature (~ 2″ x 3″) from one of our Book of Hours (MS 102) we recently digitize to support a collaborative research project in medieval manuscripts housed in Rare Books and Special Collections. Even blown up so that one square centimetre covered four of the screens the image was crystal clear.
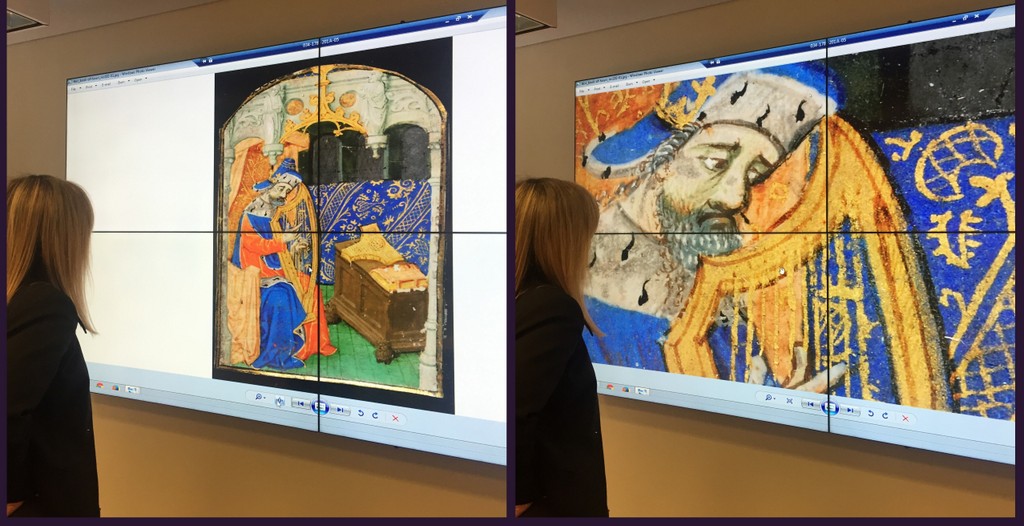
MS 102, a Book of Hours miniature on one half of the data visualization wall. [Left] Full size [Right] Close up
Our final experiment was yesterday when we hosted a graduate level multimedia class from the School of Information Studies. Here we wanted to take advantage of the large screen size and used half the screen for a presentation while on the other we used remote desktop to a computer in our lab and did a live demo colour correcting an image.
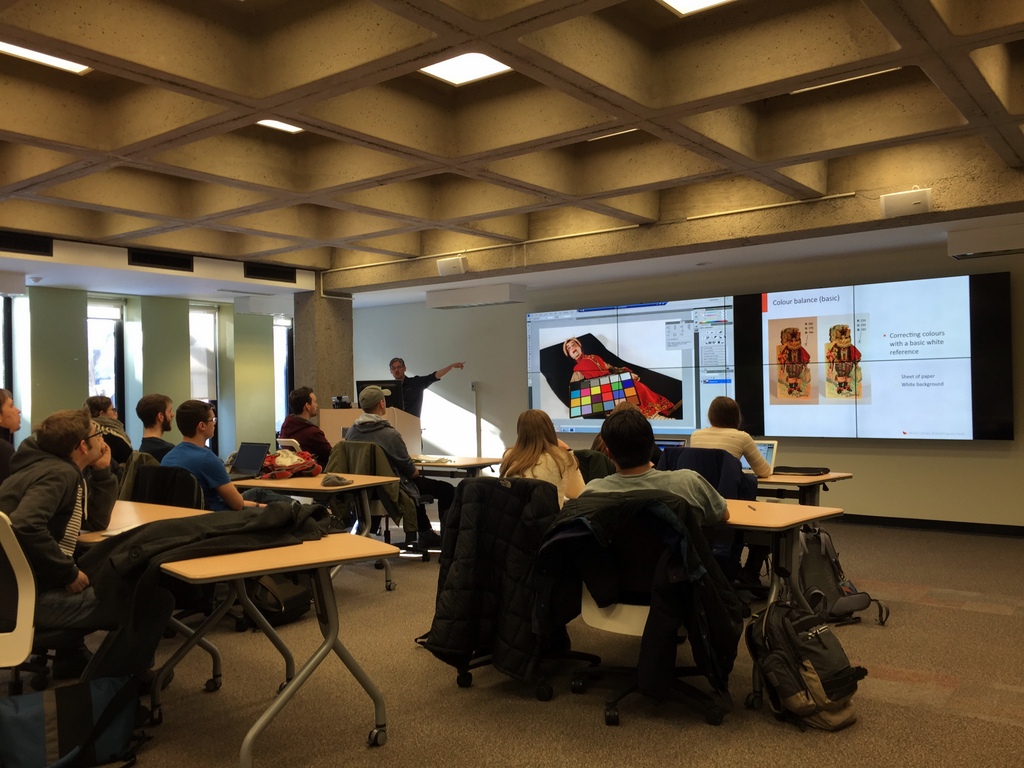
Greg Houston doing a live colour balancing demonstration on digitized images.
To learn more about the research commons you can email research.commons@mcgill.ca