Metrics 3 x 3

I wanted to do a review of the 3 big citation indexes (Web of Science, Scopus, and Google Scholar) at 3 different levels (articles, authors, and journals), since there have been some noteworthy changes this year. Citations are only a part of the story so I will point out when alternative metrics are available, such as views and mentions on social media.

A bit of history: Web of Science was launched as the Science Citation Index in the 1960s, by the Institute for Scientific Information. One thing that they did that set them apart while they were gathering information from journals, was to include each paper’s list of references. It seems like a small thing but it revealed the relationships between papers, and also provided citation counts.

Web of Science did not have any real competition as a citation index until 2004, with the launch of both Google Scholar and Scopus (from the publishing giant, Elsevier). While Web of Science is deep, indexing over 100 years of journal content, it is selective and therefore the coverage is not as wide as Google Scholar or Scopus.
  1. Article metrics

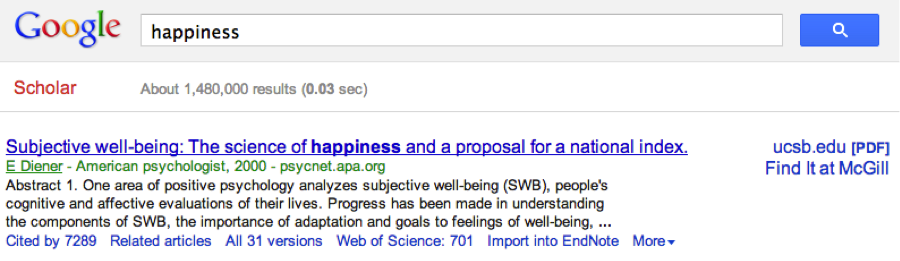
Citation counts may vary between the indexes, depending on their coverage of a subject. It is interesting to explore each one, and necessary to indicate where a count is coming from. The number is often highest in Google Scholar, since it can link to non-journal content like presentation slides.

Citations are useful in general because they allow you to move forward in time, finding newer papers that may be of interest. If a paper is important, you can always set up a citation alert to receive email notifications. Sorting your search results in Web of Science and Scopus by citations will also help you find those seed papers that are often referenced in your research area.

New in beta in Web of Science is the presence of enriched cited references in some records, with specifics on where in the text an article is cited, how many times, and in connection with which other references. They highlight hot papers, those published in the last two years with an unexpectedly high citation count over the most recent two months for their field. They also make it easy to find highly cited papers from the last 10 years.

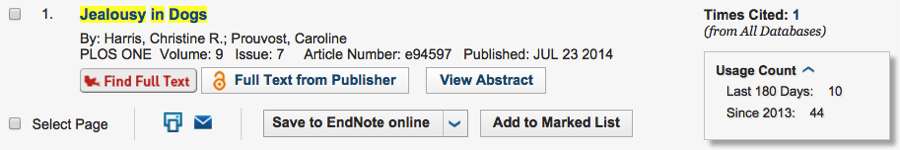
Item-level usage counts came much later in Web of Science when people became interested in seeing alternative metrics. They count how many times people click on the full-text or export an item to a citation management program like EndNote (EndNote is available from McGill Library!). You can see which papers people are paying attention to in the last 180 days, or all time (really since 2013, when they began counting).

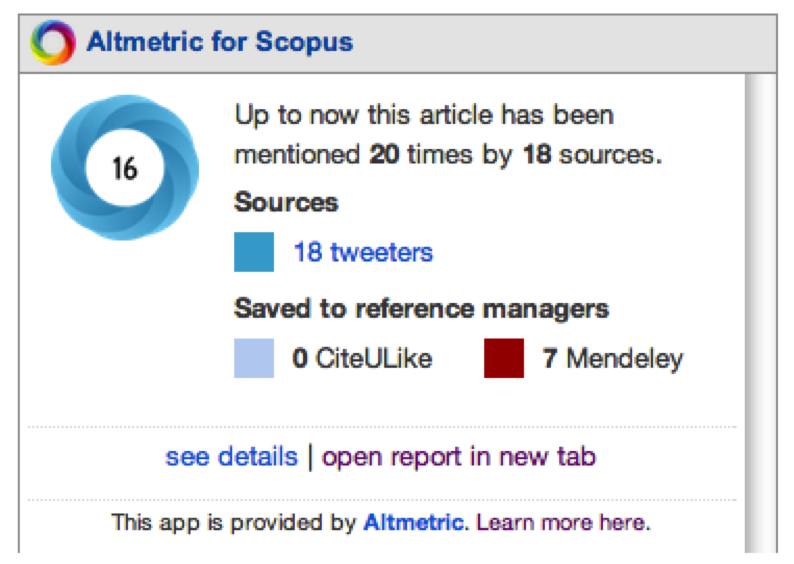
Scopus does have view counts, but they take alternative metrics further by integrating PlumX Metrics with 5 categories: Citations, usage (clicks and downloads), captures (bookmarks), mentions (blog posts, Wikipedia, etc.), and social media (tweets, Facebook likes, etc.).

2. Author metrics

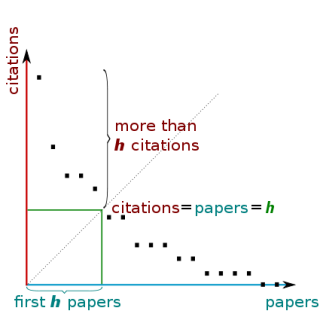
Article citations are used to calculate author metrics. A popular metric is the h-index, where the number of citations an author has received meets their number of published papers (read about this index in Hirsch’s article in arXiv). Some criticisms of the h-index are that it is dependent on the age of the researcher and also on their field, so it shouldn’t be used for comparisons.

When searching for author metrics it is useful to have these identifiers on hand, if possible:

A new visualization in author profiles in Web of Science is the Beamplot, with citation data going back to 1980. Individual points on the plot represent the citations for a given paper, divided by the mean for papers in the same Web of Science subject category from that year.

3. Journal metrics

The Journal Impact Factor and other metrics for journals indexed in Web of Science are published each year in Journal Citation Reports. Web of Science is now a collection of subject indexes and Journal Impact Factor data is provided for journals in the Science and the Social Science Citation Index. This year, Journal Citation Reports has expanded to include the Arts & Humanities and Emerging Sources Citation Index journals, with their new metric: Journal Citation Indicator. It allows for comparison of journals across disciplines. 

There is an updated CiteScore methodology in Scopus with a 4-year publication window (the Journal Impact Factor has 2 years to build up citations). You can choose to rank only open access journals in a subject by CiteScore. You can also find out what percentage of a journal is made up of review articles (reviews are often highly cited), or is never cited at all, by using the Scopus source comparison tool.

Google Scholar does have a metrics page that ranks journals by h5-index (h-index for articles published in the previous 5 years). They can be organized by category and sub-category.

Journal metrics are not meant to be used to judge the research of individuals, but they can come in handy when you are deciding on where to publish your research. Still, they are no substitute for the advice of trusted experts.

I probably went on for too long, so please let me know if you have any questions!

Usage Counts in WoS

Web of Science Usage CountsWe are used to going to Web of Science to see how many times a particular paper has been cited but if you haven’t used the database in a while, you may not have noticed that they added alternative metrics.

Usage counts are now provided that add up the number of times the full text links of a paper have been clicked, and the number of times that it has been saved for use in a bibliographic management tool. Counts are provided from the last 180 days or since since February 1, 2013.

For more info on impact measurements, visit our guide.

McGill researchers make another highly cited list

The first edition of the list of 382 Highly Cited Researchers (h>100) according to Google Scholar Citations includes two McGill scientists: Alan Evans has an h-index of 152, putting him at #34 in the list, and Andreas Warburton is #99 with an h-index of 128. Alan Evans is no stranger to citation fame, as he was also included in the 2014 Highly Cited Researchers list from Thomson Reuters, along with Chemistry professor, Chao-Jun Li (read more on this from McGill News and Events).

The h-index marks the place where the number of citations a researcher receives meets the number of papers they have published (see the graph below). Read more about the h-index from Hirsch’s article in arXiv.

h-index

You can create your own citations page in Google Scholar by looking for the “My Citations” option.

Image is in the public domain.

Try this: Altmetric it

Last year I posted on Altmetric for Scopus where you can find metrics, like tweets, blogs, and saves to citation managers, that are alternatives to the traditional citation counts. Altmetric now has a tool to allow you to see these metrics for articles that you are viewing in your browser. I installed this Altmetric bookmarklet to my bookmarks bar. Give it a try and let me know what you think.

Cited reference analysis

When it comes to evaluating scientific papers, citation counts are mentioned more often than not. A paper can be cited for a variety of reasons but it is generally agreed that citations are one of many indicators of impact. There are a number of resources that are either free or subscribed to by the Library for looking up citing references, such as Google Scholar, Scopus, and Web of Science.

The authors of The Wisdom of Citing Scientists discuss the limitations of citing references for assessing the usefulness of papers. For example, one cannot assume that a paper with few citations has been widely read and critiqued. It is possible that the paper was not found by others or that it did have some influence on future writings. They argue that cited references in a paper tell a more complete story, revealing a scientist’s preference for particular journals and theoretical approaches, and his/her ability to identify relevant, current, and high quality publications. As librarians we are always stressing the importance of examining the reference list of a paper so it was quite nice to see this articulated.

Google Scholar includes WoS citations

GoogleScholar_Turret_Sept6_2013

The “Cited by” option in Google Scholar now includes a link to citations in Web of Science. Take a look under the reference to the article in this screen shot. Google found 7289 citations from all sorts of items on the web, but also links to the 701 citing articles in the multidisciplinary database, Web of Science. I was using Google Scholar today to send references over to EndNote but this is a nice new feature that I will be sure to explore further.

Google Scholar Metrics

We have blogged in the past about metrics for measuring impact, such as the well known Journal Impact Factor, and more recently Altmetric, so I thought that I would bring your attention to Google’s lists of top publications. As part of the Google Scholar Metrics offerings they have rankings of the top 100 publications in several languages.

Google has added categories and subcategories for the English language rankings, so now you can look up the top publications in, for example, Geophysics in the Physics & Mathematics category, or Robotics in the Engineering & Computer Science Category.

The usual suspects are there in the list, like Science, Cell, Nature, Physical Review Letters, but you may find some interesting results. How amazing is it that arXiv (open access e-prints in physics, mathematics, computer science) is frequently listed by the separate subject areas?

Happy Monday!

Altmetric for Scopus

AltmetricForScopus

The next time that you find an article of interest in the Scopus database, click on the title and look for this Altmetric for Scopus box. The article will get a score, based on how much attention or buzz it is getting online. For example, this article was mentioned by 18 tweeters and was saved by seven individuals to their Mendeley references. You can read the tweets and see how many of them are coming from the general public, versus scientists, practitioners, or journalists and bloggers. The app will also tell you how the article ranks and if the Altmetric score is good compared to other articles that came out around the same time and from the same journal. Alternative metrics like these are great for going beyond the standard citation count, h-index, or journal impact factor, and can provide some realtime feedback.

Webometrics

There is no shortage of university rankings to be found on the Internet but I’d be hard pressed to find one as inclusive as the Webometrics Ranking, or as dedicated to self-improvement. The ranking, produced by Cybermetrics Lab (a research group of the Spanish National Research Council), covers more than 20 000 universities worldwide. They designed indicators of impact (links in to the university domain from third parties), presence (university pages found in Google), openness (files found in Google Scholar, including PDFs and other files from a university’s repository), and excellence (highly cited papers in scientific fields). It is quite an interesting methodology.