I was just on the American Journal of Physics website and I noticed that they had made this 1976 article, from Nobel Laureate Luis Alvarez, freely available to commemorate the 50th anniversary of the assassination of President John F. Kennedy. So very interesting.
Posts By:
Superfast scientist
Associate Professor Bradley Siwick, a Canada Research Chair in Ultrafast Science, delivered a Cutting Edge Lecture in Science in January (I’m falling behind on my posts!): Lights, action, camera – Making movies of molecules and materials. I have a background in microbiology so I was keen to hear about some of the tools and techniques that he has been using in his lab.
During his talk he pointed out how the 20th century was all about the development of new tools, like the electron microscope (one of the greatest Canadian inventions, as voted on by CBC watchers, just six spots behind the poutine). In the 21st century we can expect to see scientists pushing the limits of these tools. His research is taking a novel approach to electron microscopy, using femtosecond lasers to produce ultrashort/ultrafast pulses.
Visit Bradley Siwick’s research site to learn more.
I highly recommend attending one of the upcoming lectures as well, if you get the chance.
New impact crater (i.e. my new wallpaper)
This amazing image is a crater on Mars taken by a high resolution camera, a High Resolution Imaging Science Experiment (HiRISE) camera to be precise. NASA released it this week, although a space rock caused this crater between July 2010 and May 2012 when they were imaging the site.
The crater is 30 metres in diameter and the resulting explosion threw debris as far as 15 kilometres away.
Visit this site if you’d like it to be your new wallpaper too.
Image from: The University of Arizona
Welcome Pauline!
The Turret is going to see a few new bloggers this semester, undergraduate students taking the Communication in Engineering course here at McGill.
To kick this off, it is my great pleasure to welcome Pauline (and her little brother).
We are all looking forward to hearing what Pauline will share with us on The Turret (no pressure!).
Arsenic, you say? Sounds plausible. Accept.
There is a new hashtag getting attention this week: #SixWordPeerReview
Researchers are expressing their frustrations with the peer-review process and sharing some interesting six word responses from referees.
Open science publisher, F1000Research, sums it up on Storify and points out how their peer-review model addresses some of the concerns.
Fail early | Fail often
According to Jason Dunn, fail early and fail often should be the mantra for private industry in order to learn and move forward. He is an engineer and a cofounder of Made in Space, a company with a NASA contract to take 3D printer technology and apply it to space missions.
We have posted before on 3D printers in The Turret, and lately articles on the application of 3D printing in the world of food are everywhere: spooky meat-like bio-pastes, chocolate(!), and NASA’s hopes of using 3D printing to make space food. Made in Space is taking this further and proposing that rather than build equipment needed in space on Earth, and spend decades getting it right, it is possible to build everything in space with 3D printers. We can email hardware to space.
After you watch the video from TEDxTalks, you may want to read the book that inspired Jason Dunn to want to build colonies in space – The high frontier: Human colonies in space by Gerard K O’Neillvideo – that he discussed in a previous TEDxTalk.
Periodic Table of Visualization Methods
I am a big promoter of using concept mapping to access the implicit knowledge that is trapped in our brains. Concept maps are graphic representations of knowledge that facilitate the organization of information, whether it is for a project we are planning or for research we are engaged in. I use the CmapTools software since it also allows me to save concept maps on a server and share them online.
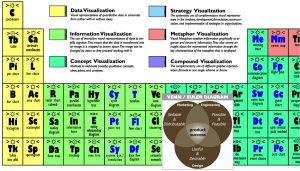
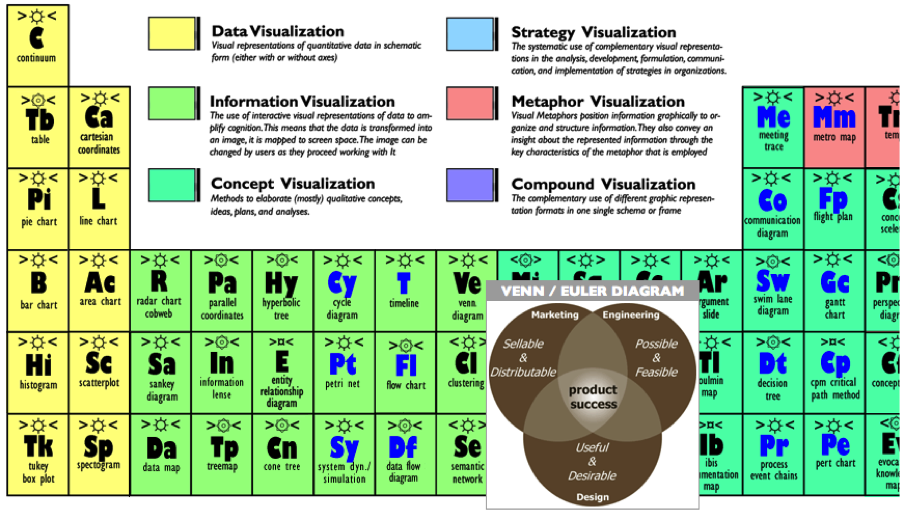
It is, however, not the only technique for concept visualization, which is why I have often turned to the Periodic Table of Visualization Methods for inspiration. The table also includes methods for visualizing quantitative data (pie charts, line graphs, etc.) mapped to the alkali metals, methods for information visualization that transform data into images (data maps, flow charts, etc.), strategy visualization used commonly in management (such as stakeholder maps), metaphor visualization to convey insights about information (metro maps, bridges, etc.), and, lastly, compound visualization methods that bring together multiple graphical representation formats. Each element box also has additional information, such as the mode of thinking.
If you have any trouble scrolling over the element boxes and would like to see each of the methods separately, Chris Wallace has implemented an XML page that allows you to hide or view each image and also links out to Google images and Wikipedia entries.
Next week I will be attending the Visual Thinking with Mind-Mapping and Creative Modeling workshop at the School of Continuing Studies. I will be sure to post on what I learn there and share any new resources I come across. If you have any to share please do so in the comments box.
Have fun expressing yourself with these visualization methods!
Better bidding through game theory
If you have ever imagined yourself on The Price is Right, spinning the Big Wheel to make it to the Showcase Showdown then what you need is Slate’s Ultimate The Price is Right Cheat Sheet – seriously.
Helpouts by Google
Google has started this site, Helpouts, connecting people who need one-on-one help with people who can offer it. Some of them cost money but many are free. Here are the broad categories: Art & Music, Computers & Electronics, Cooking, Education & Careers, Fashion & Beauty, Fitness & Nutrition, Health, Home & Garden. You can even sign up and offer your own face-to-face Helpouts and schedule appointments to teach others what you know. Of course, if you’d like to schedule an online appointment with a science and engineering librarian at Schulich Library we’d be happy to set up a date and time.
Bizarre Border
I had never really considered the deforestation involved in carving out the Canada / U.S. border. It is a long (8,800 km) deforested wonky line.
Video from CGP Grey